


As we try to understand the forces at work in the landscapes we depend on, it helps to see long-term patterns of how fire interacts with water, vegetation, soils, climate, and human development over time and space. As fire researchers yield rich new data sets, The Burn Cycle Project helps communicate their meaning, patterns, and possibilities to select audiences. We choose a combination of both cutting-edge and traditional tools of art to make the invisible, visible. In collaborating with those who have specialized understandings in their fields we translate key findings about fire into a dynamic media experience. In this way, Burn Cycle gives a long view on fire while having boots on the ground to integrate multiple perspectives.
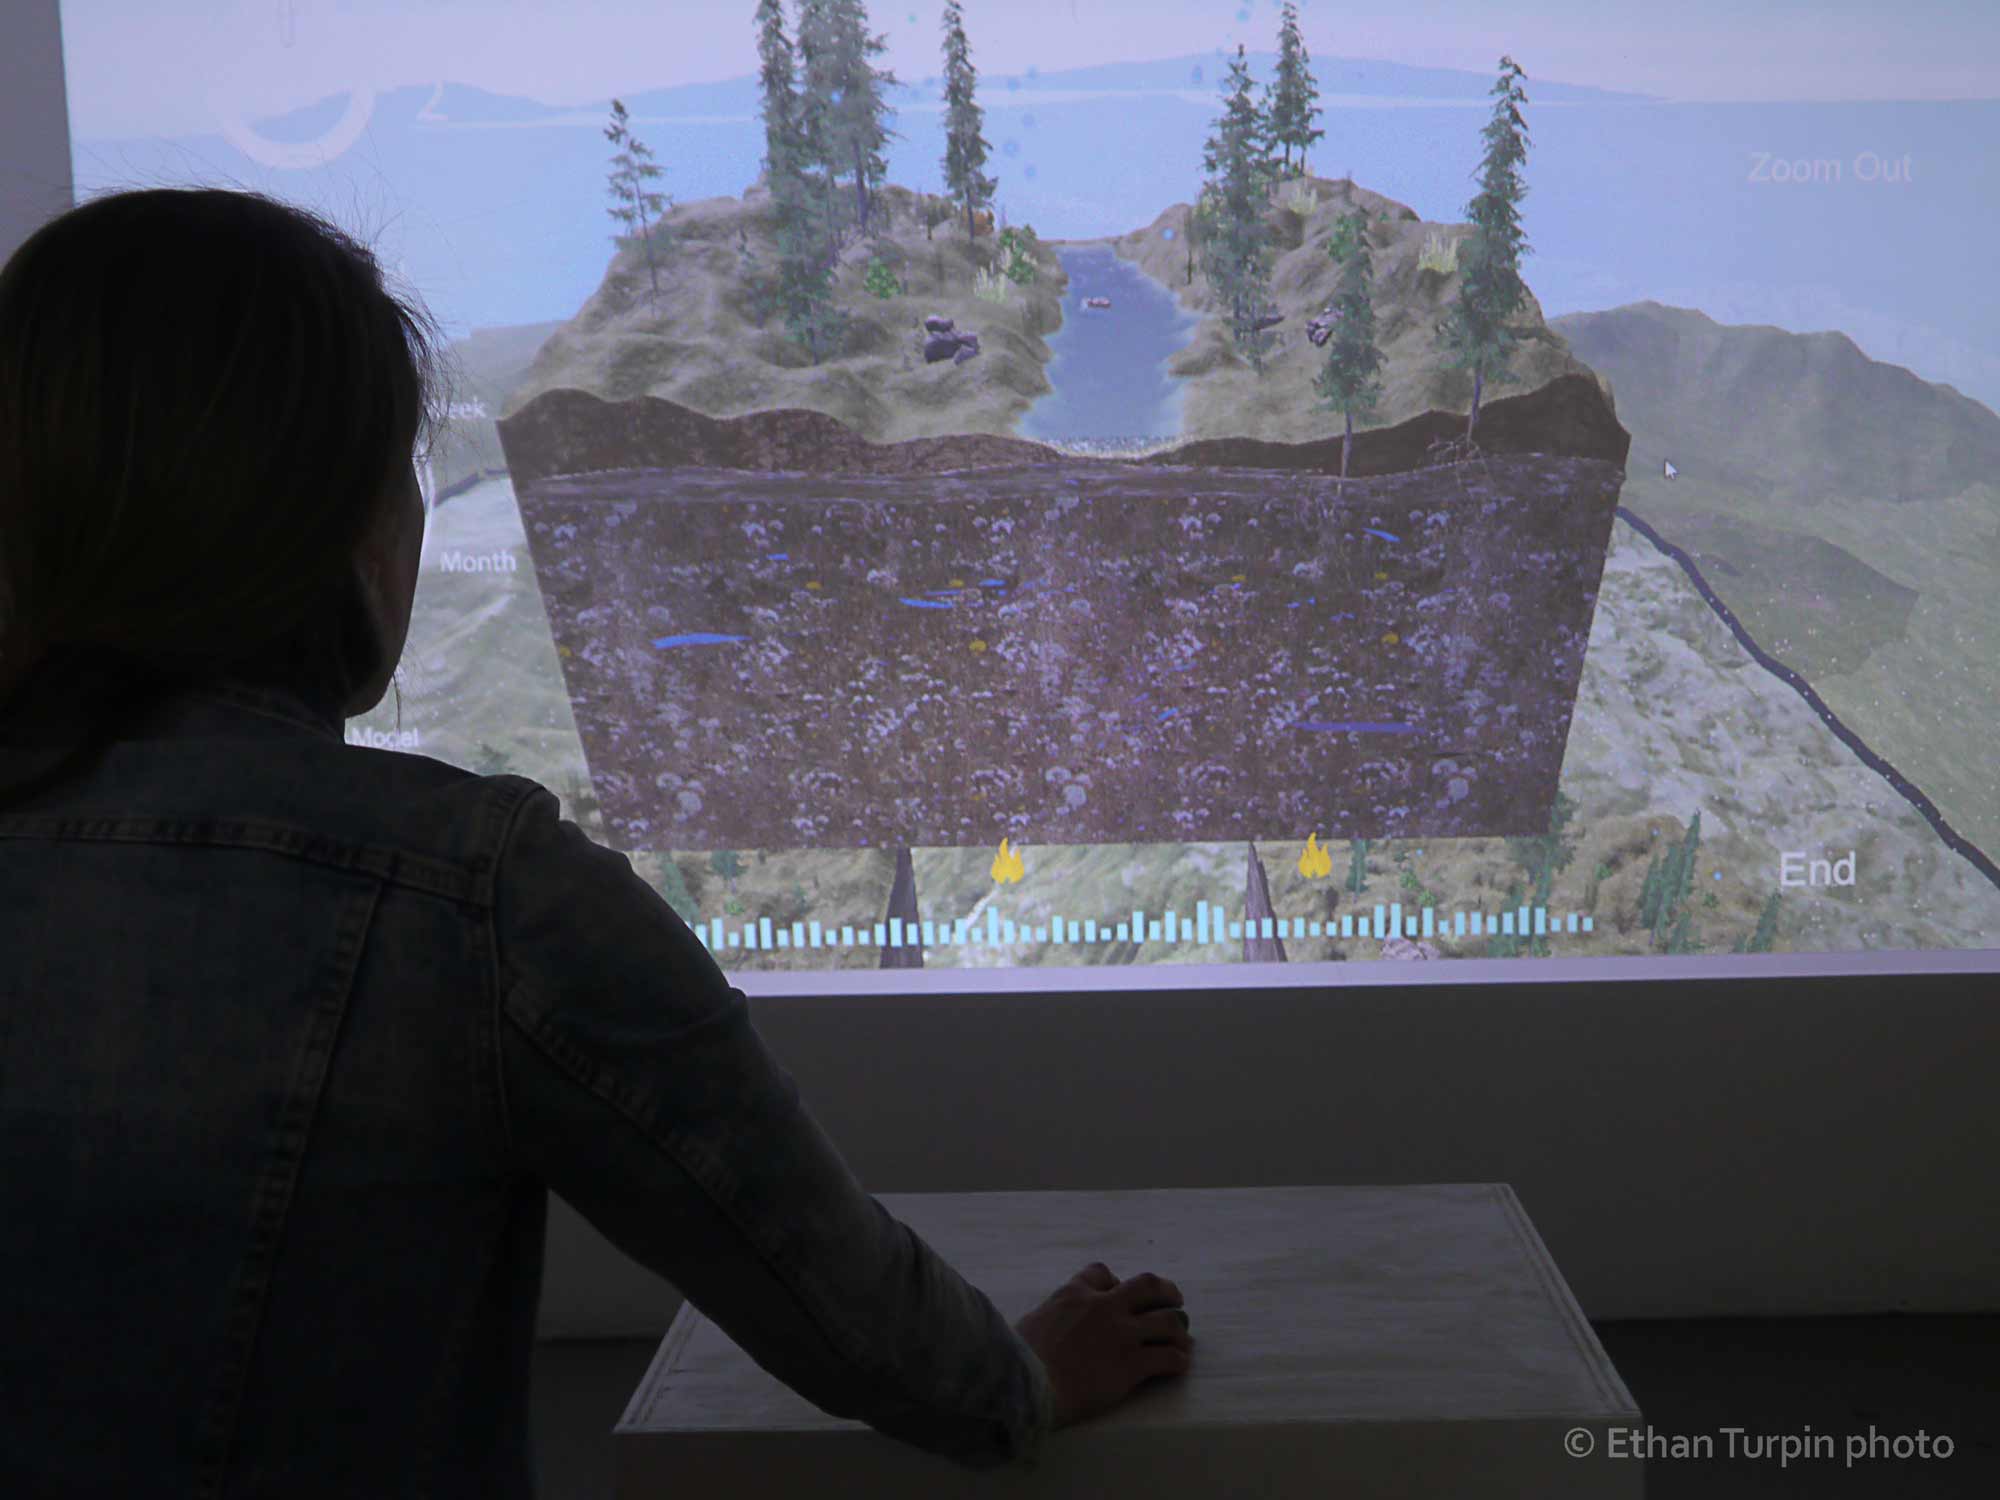
Pictured: A user with “Future Mountain: An Interactive Fire, Water, and Climate Model”.
Burn Cycle has developed “Future Mountain: An Interactive Fire, Water, & Climate Model” for researchers and the public. Professor Naomi Tague’s RHESSys model provides rich data of landscape dynamics, compiled from thousands of sources. In her conversations with exhibit designer Ethan Turpin, she described “how landscapes work” over cycles of fire and water. Ethan iterated sketches with her input, constantly refining a visual model. As this development broadened they brought in programming artist David Gordon to process the data sets within a videogame environment. In exhibits, users manipulate settings in the 3D visualization to see how chance and choices may play out in real world landscapes.
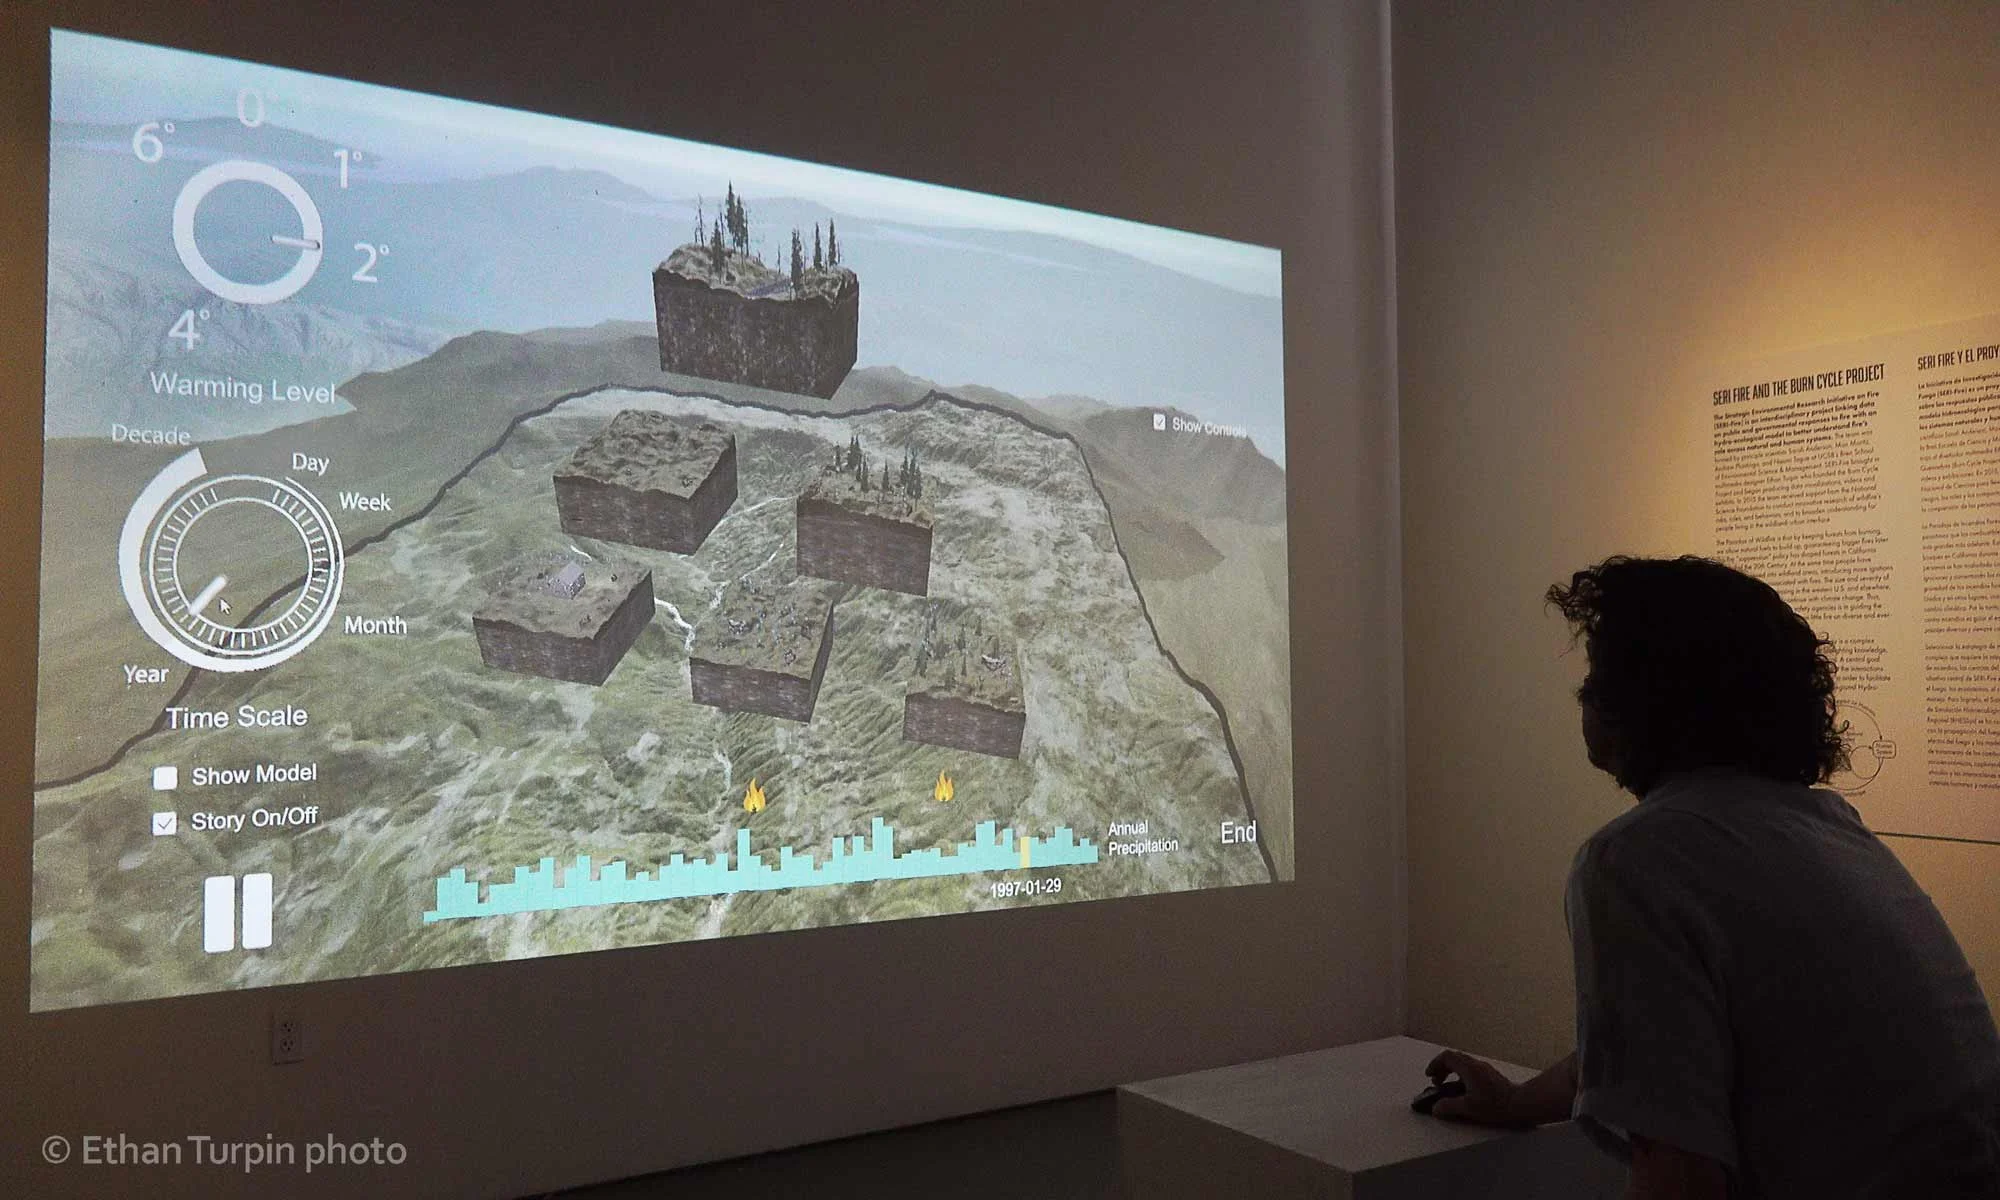
Future Mountain: An Interactive Fire, Water, and Climate Model is designed to compare select areas, or "cubes", of a dynamic landscape. The simulated area is Big Creek in the Southern Sierras, an important watershed for Southern California communities. Users can compare different climate scenarios for the same cube using Side-by-Side mode.
In April of 2019 the Burn Cycle and SERI Fire team produced a public exhibit about wildfire science and management in downtown Santa Barbara with the help of community partners. This demo video focuses on two primary features of the exhibit. “Future Mountain: An Interactive Fire, Water, & Climate Model” renders over 60 years of data from an important watershed in the Southern Sierras and lets users adjust a climate warming knob to observe different scenarios over time. “Walk Into Wildfire” uses audio and video from fireproof camera boxes to give visitors a safe point of view within rapidly burning forest vegetation.
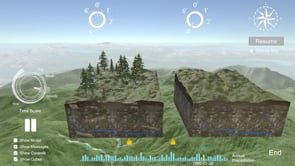
Close-up of south-facing “Cube B” during a simulated scenario in “Future Mountain”. Designs by David Gordon and Ethan Turpin.
“Future Mountain” user demonstrations during the Climate Roundtable at Direct Relief, 2019. Isaac Hernandez Photo
Conceptual drawing for interactive landscape model by Ethan Turpin
Conceptual drawing detail
Graphed data from Tague Lab of fire effects on verifying forests for down-stream water availability.
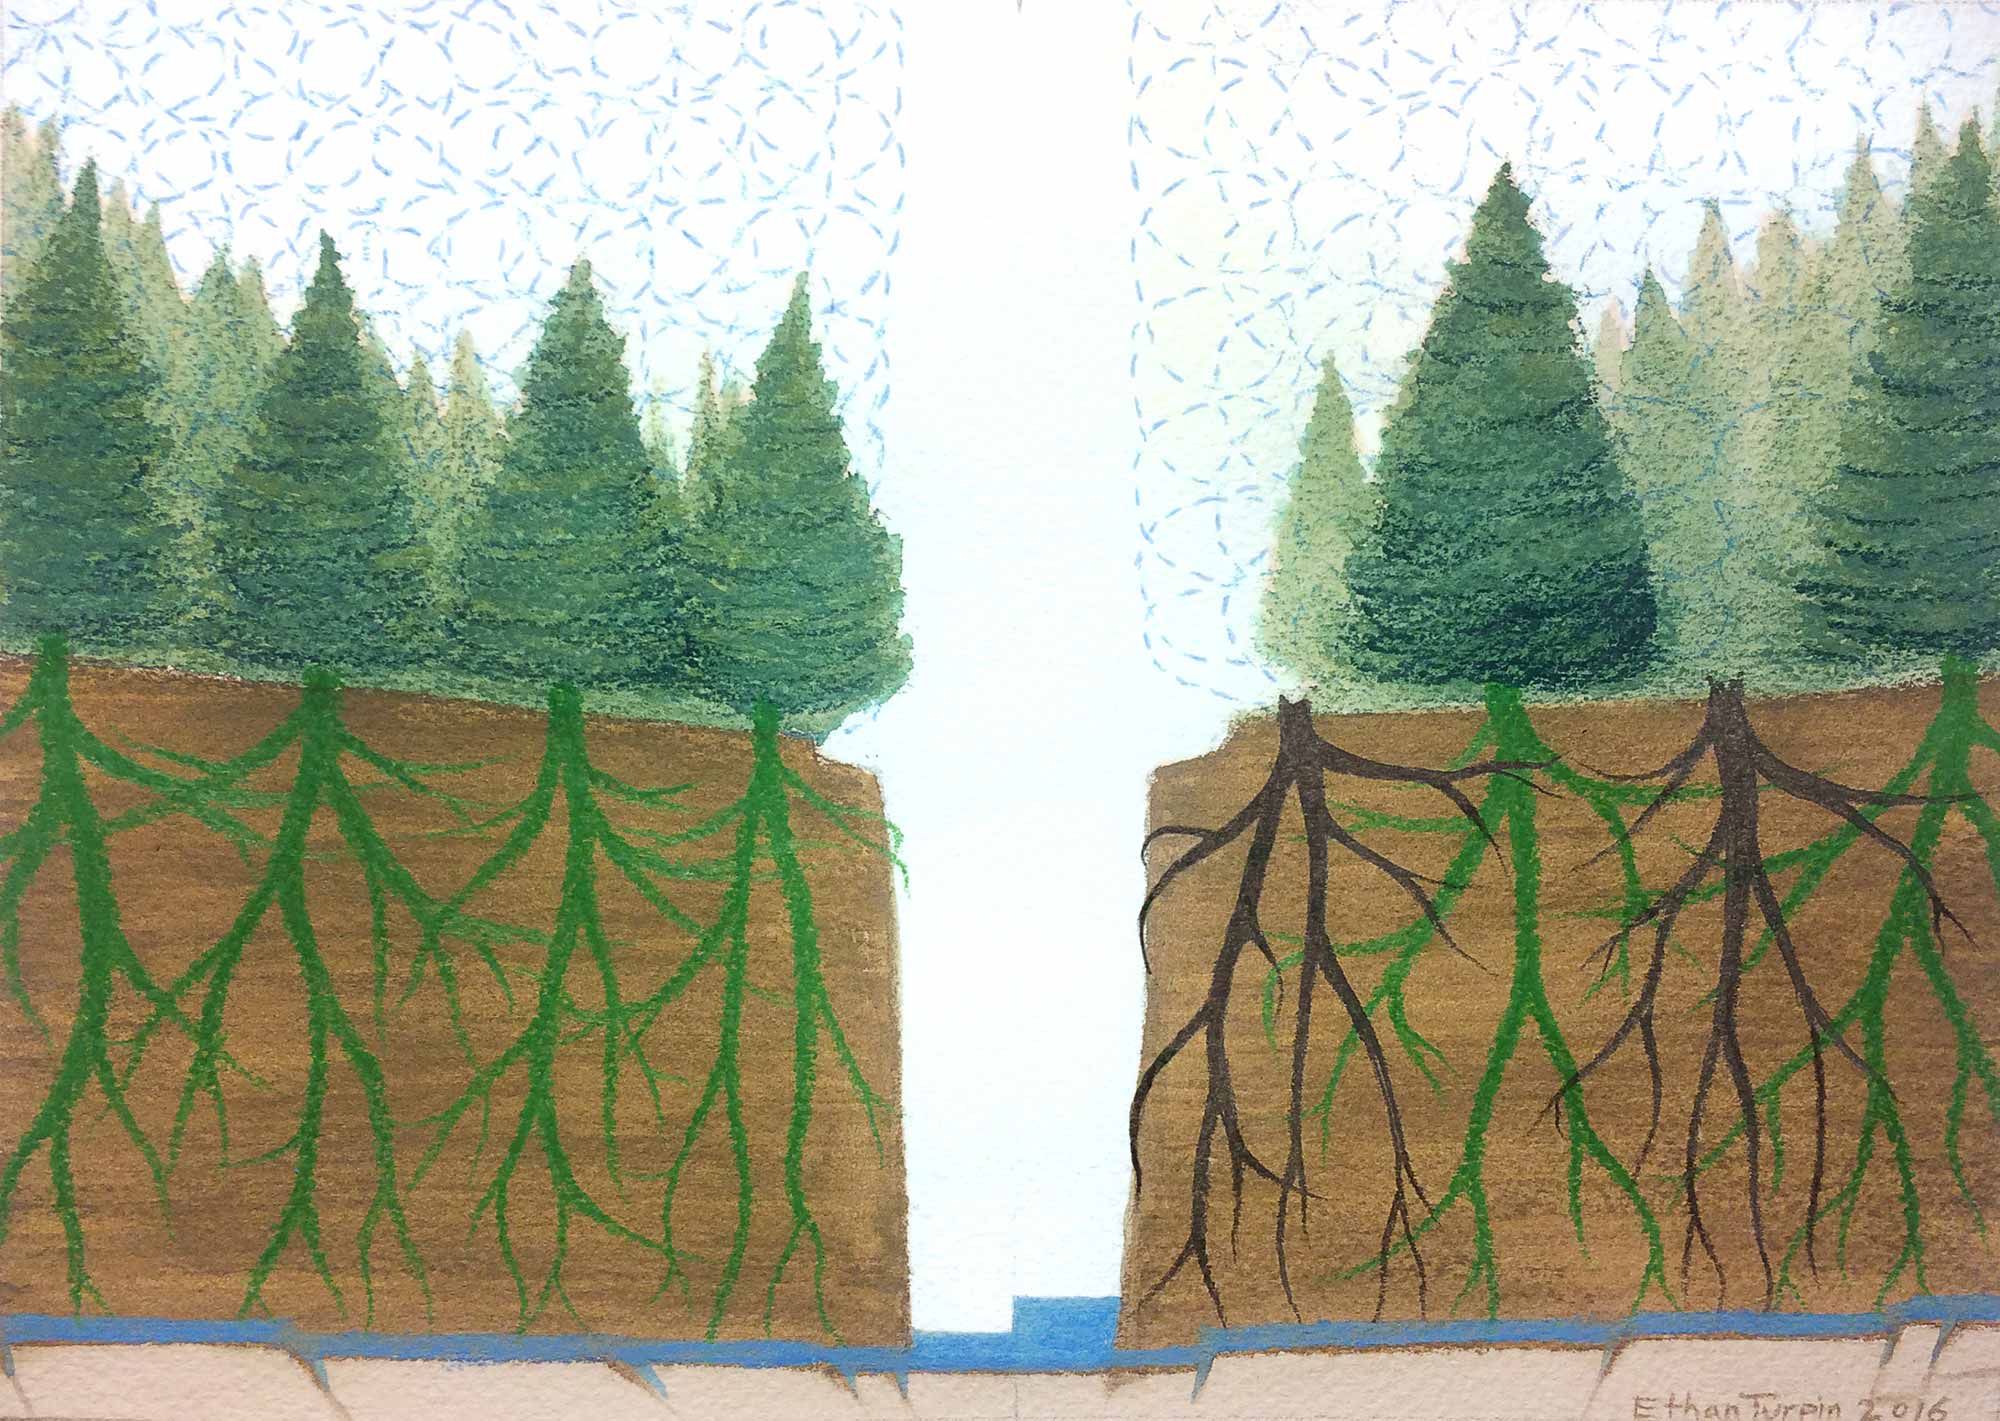
Ethan Turpin’s illustrations of differences in water availability after burning among forests with co-mingled roots and shallow soil.
Ethan Turpin’s illustrations of differences in water availability after burning among forests with co-mingled roots and deep soil.
Burn Cycle founder Ethan Turpin is teamed with a group of researchers from the Bren School of Environmental Science and Management to observe and communicate complex relationships between humans, landscapes, and fire. The National Socio-Environmental Synthesis Center (SESYNC) in Annapolis, Maryland supported the team’s collaborative process by providing a space for interdisciplinary discussion with land managers and scientists in a range of fields.
Film by Elizabeth Herzfeldt-Kamprath with cinematography and production support by Ethan Turpin.
AVIRIS remote sensing gave view of active heat and burning during Santa Barbara’s Jesusita Fire, along with a clear view of dense riparian vegetation. Collaboration between Geography Professor Dar Roberts and Burn Cycle’s Ethan Turpin for UCSB Library exhibit.
AVIRIS remote sensing of fire histories along California's Gaviota Coast and Santa Barbara, captured during the 2009 Jesusita Fire. Visualization by Dar Roberts and Ethan Turpin.
A LiDAR point cloud registered with Google satellite photography reveals burned homes in Santa Barbara’s Jesusita Fire. Still frame from an animation exhibited by Burn Cycle in collaboration with Geography Professor Bobo Bookhagen.
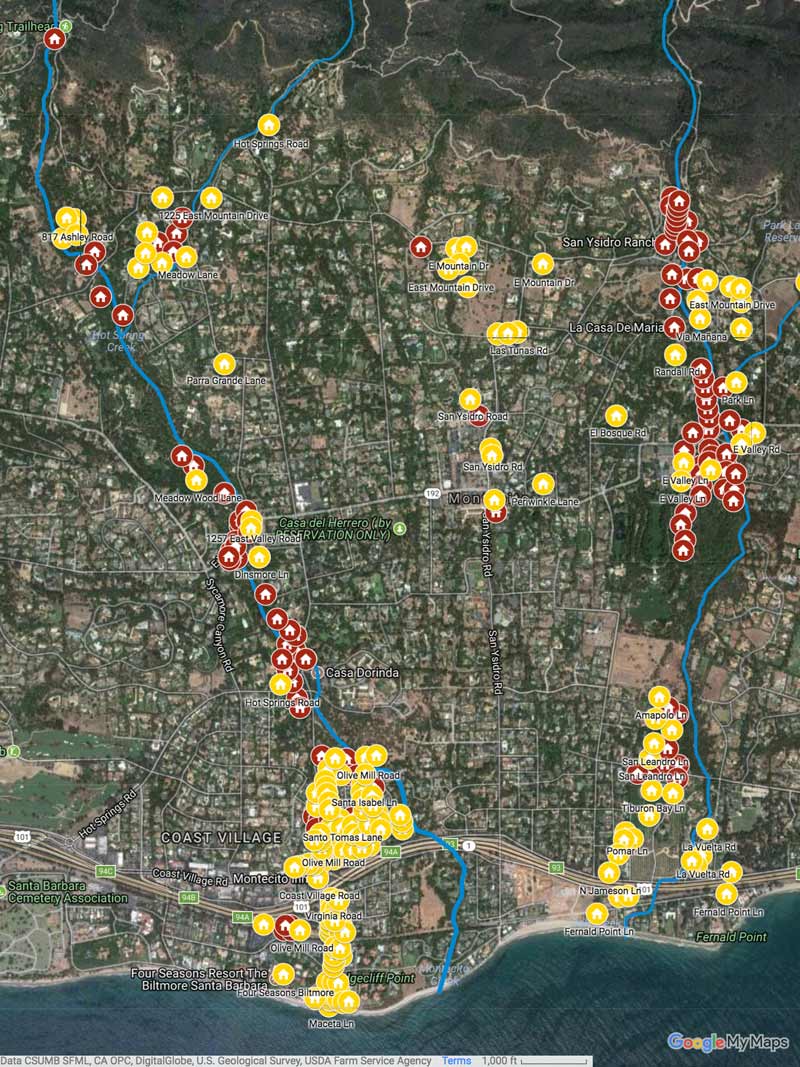
Ethan Turpin worked with The Santa Barbara Independent newspaper to visually assess and pin-point affected areas during catastrophic debris flows in Montecito following the 2017 Thomas Fire. By walking the creeks and mud-filled streets with cameras, notepads, and GPS, the team was able to compile an interactive map with vital information for evacuated residents about the status of homes.